Performance Report
The Performance Report provides a summary of ratings, reviews, and requests for a single location in real-time. You can also receive a copy of the report via email on a weekly or monthly basis.
Understanding the Performance Report
The Performance Report displays metrics for a single location including Net Promoter Score®, survey questions, reviews, and requests. By default, the date range for the report is set to Lifetime but it can be adjusted.
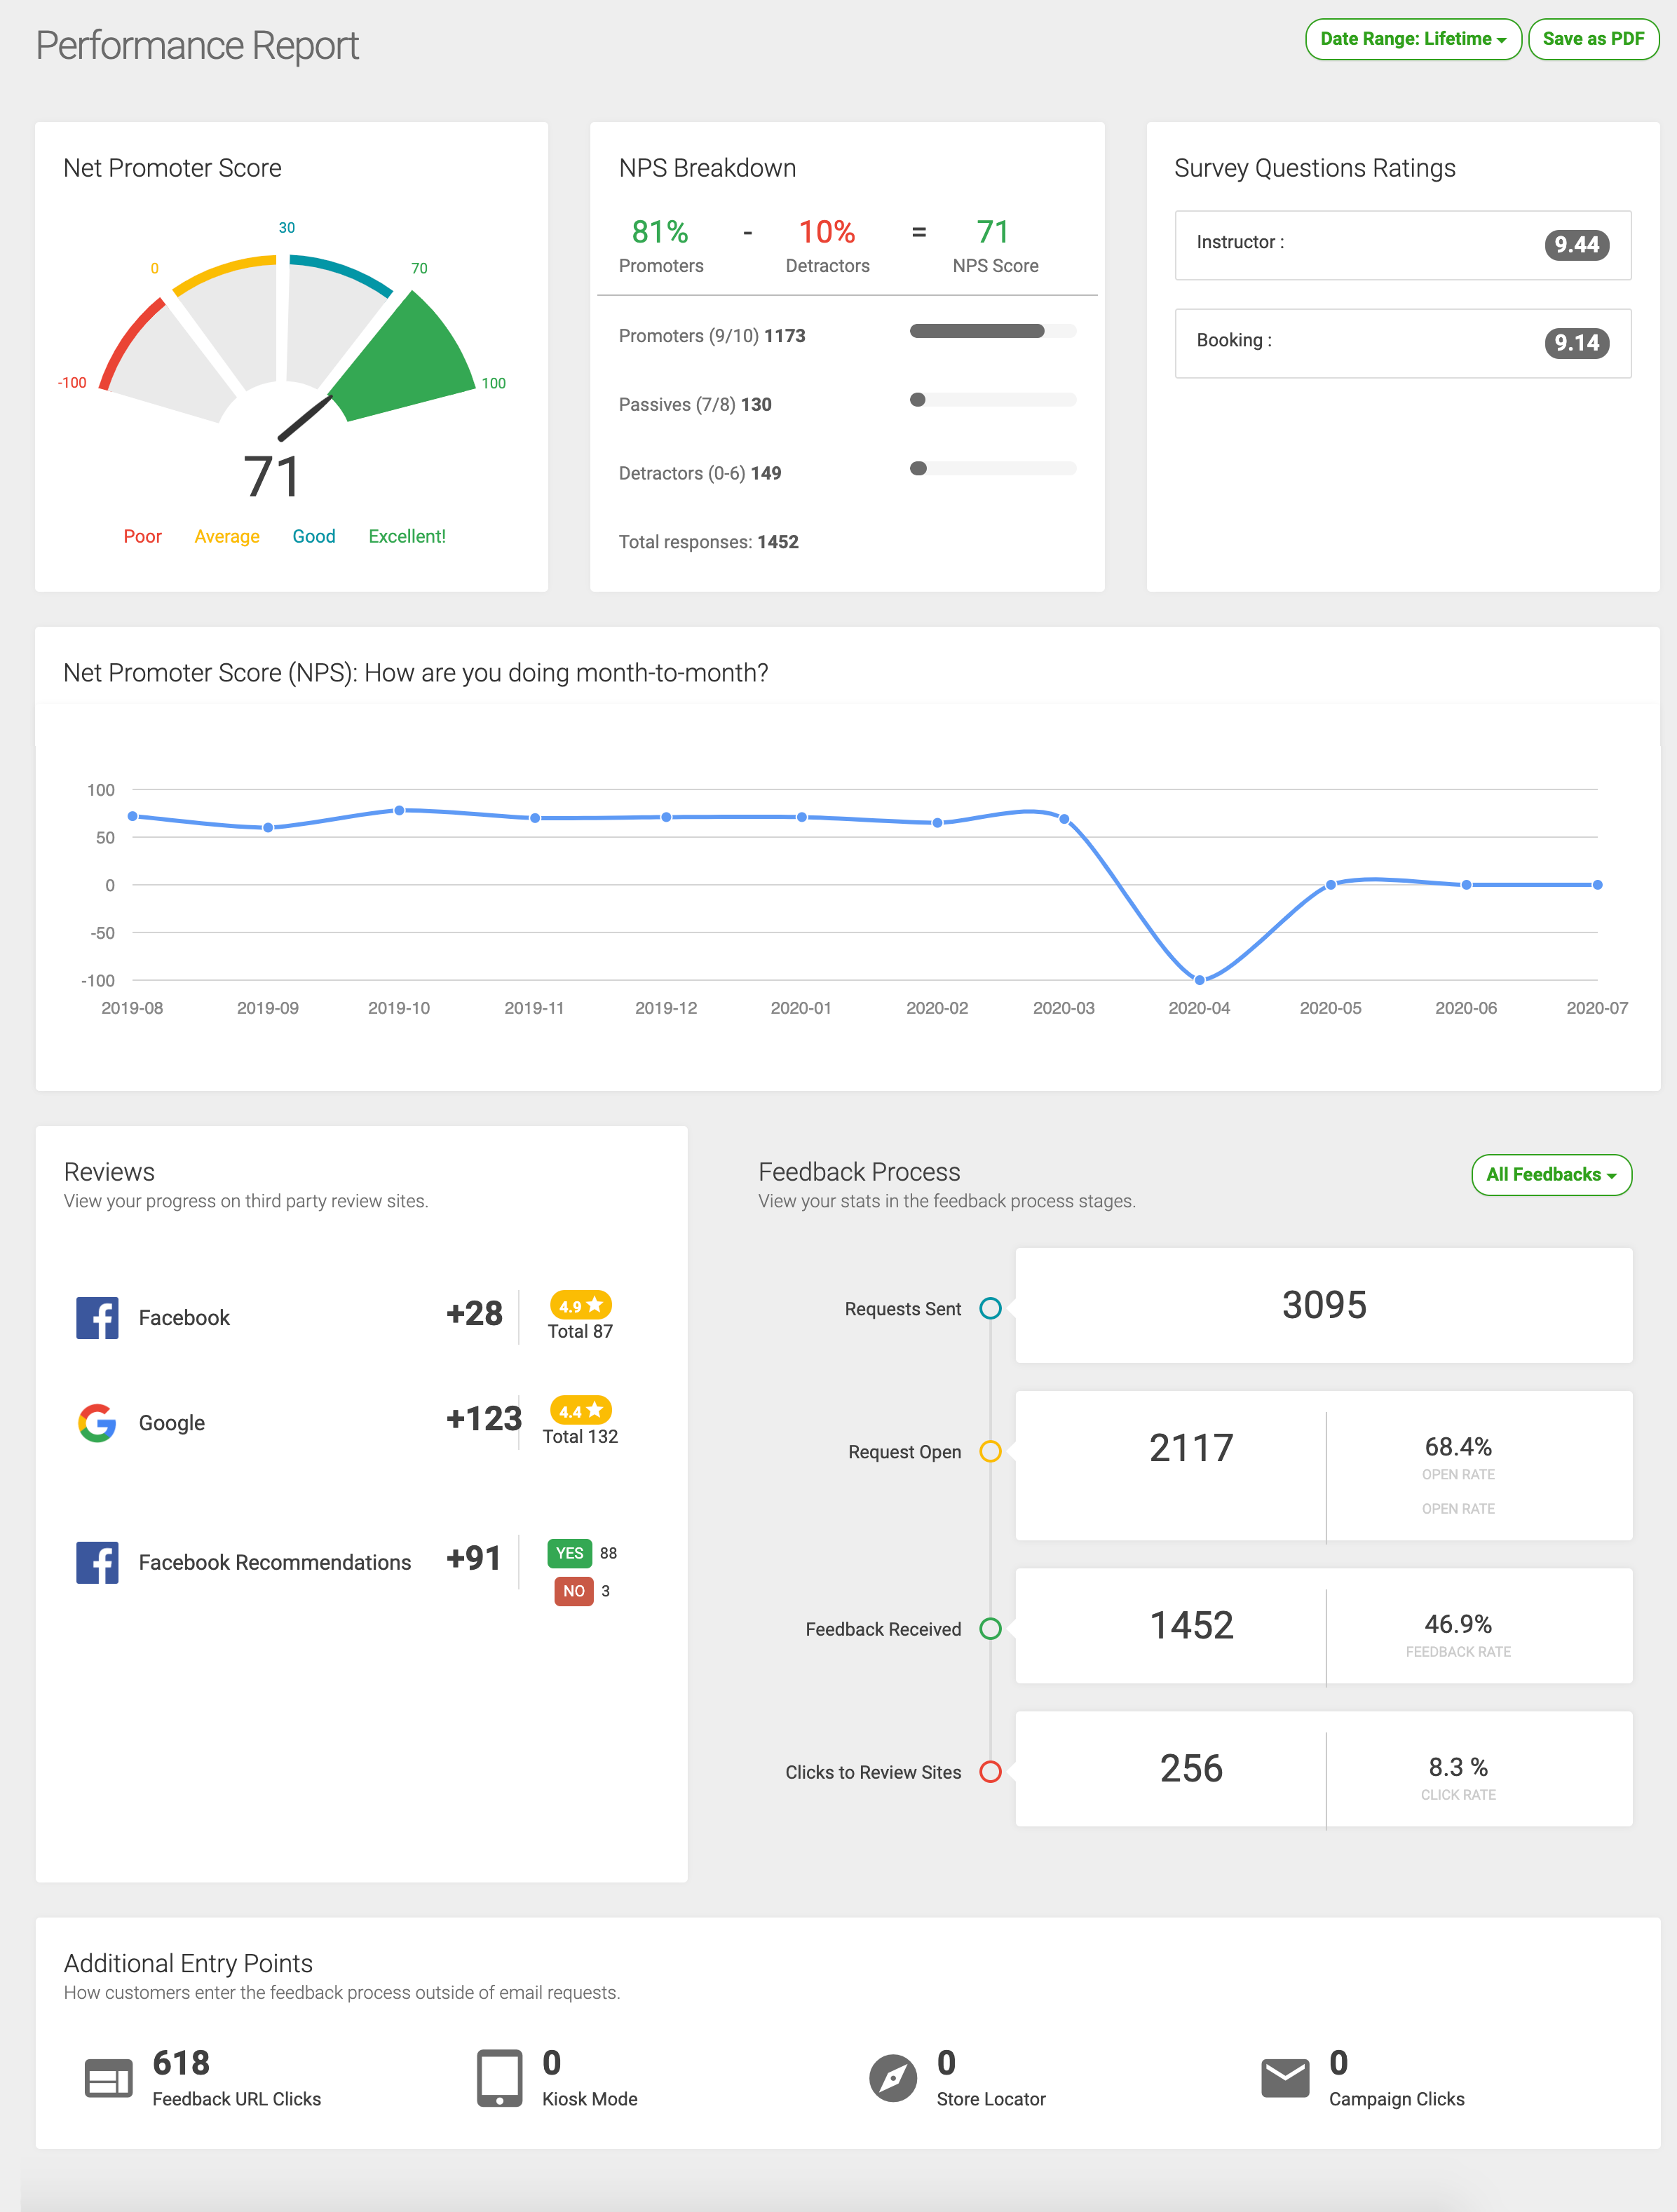
The Performance Report displays metrics for NPS, survey questions, reviews, and requests
Net Promoter Score®
The metrics displayed for the Net Promoter Score® (NPS) include the current rating, NPS breakdown, and month-to-month change for a single location.
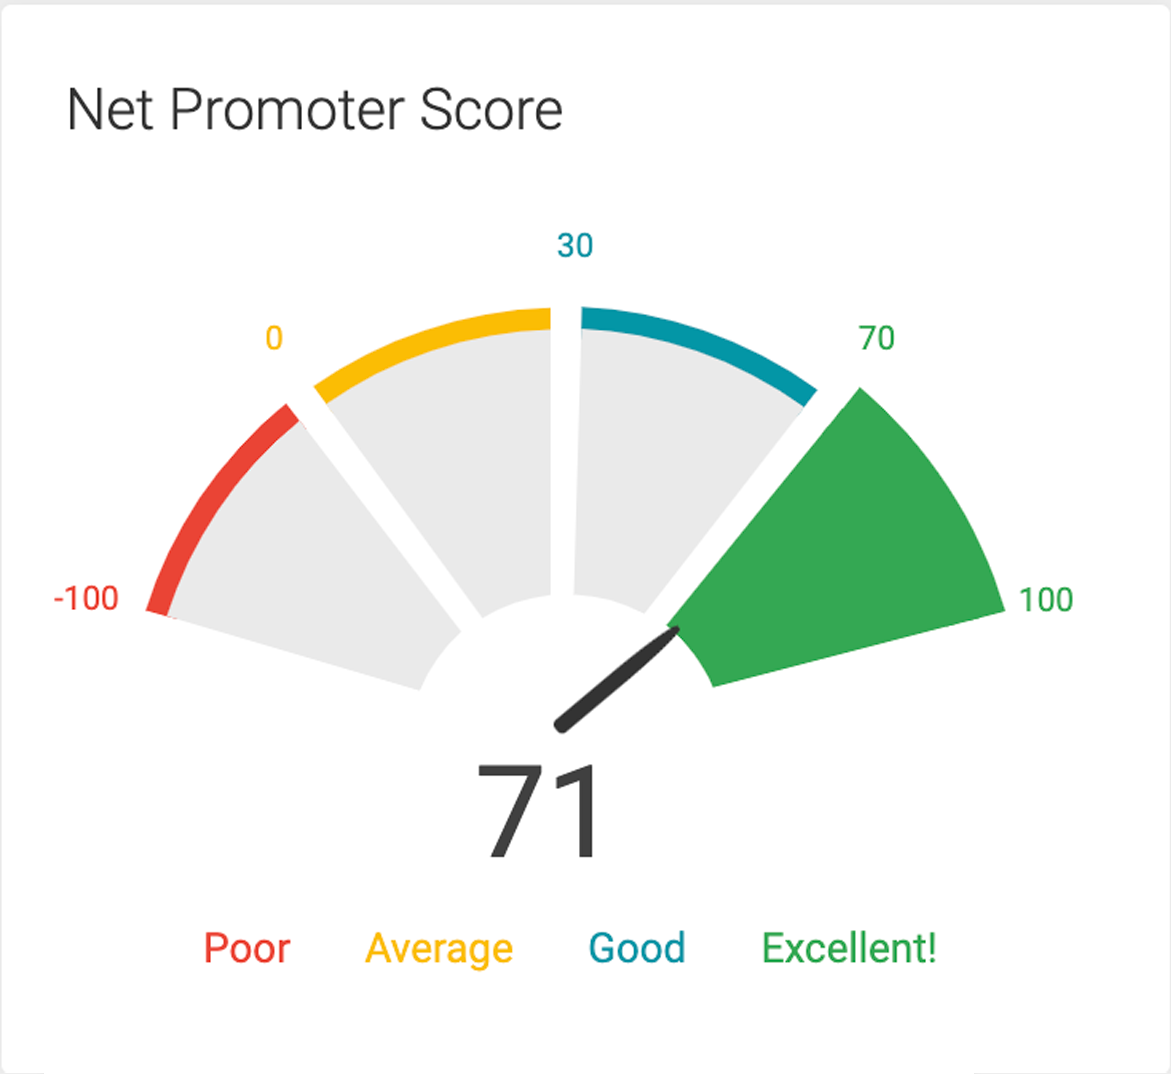
The Performance Report displays the current Net Promoter Score® for a location
The current Net Promoter Score® is assigned to a performance category. NPS performance varies across industries but generally the following applies:
-100 (every responder is a “detractor”) to -1 = Poor 0 – 29 = Average 30 – 69 = Good 70 – 100 (every responder is a “promoter”) = Excellent
The NPS Breakdown shows the total number of responses and how many are Promoters, Passives, or Detractors in order to display how NPS is calculated.
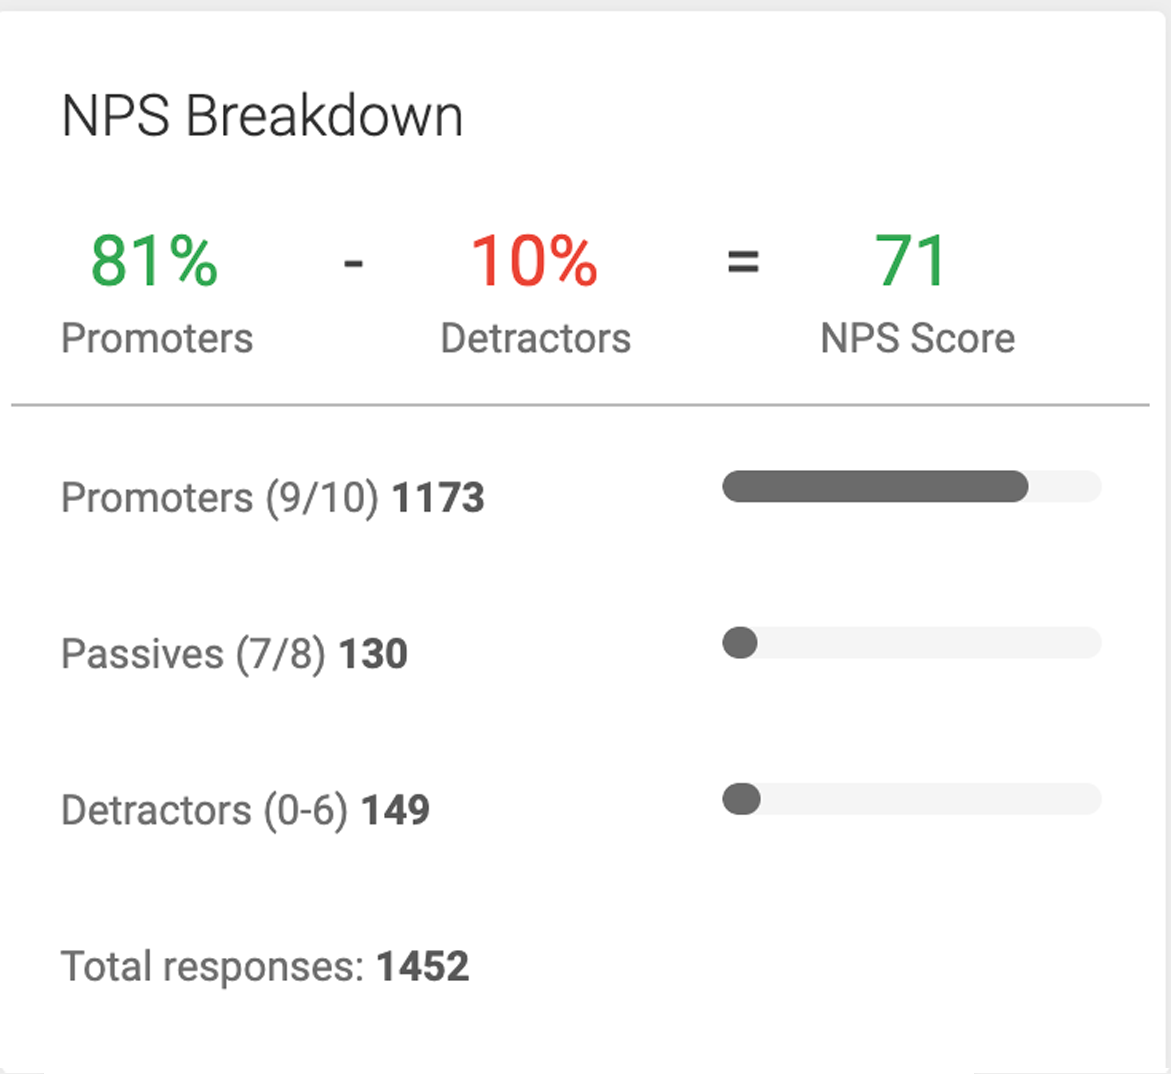
NPS Breakdown is included in the Performance Report to display how the Net Promoter Score® is calculated
NPS month-to-month tracks the total number of respondents that answered the NPS question for a business location in a given month and the calculated NPS score of those replies.

NPS Month-to-Month tracks the NPS score of new replies received in a given month
Survey Questions
If your location is set to Ultimate Request Mode and you add additional survey questions, the Performance Report displays the average rating received for each question.
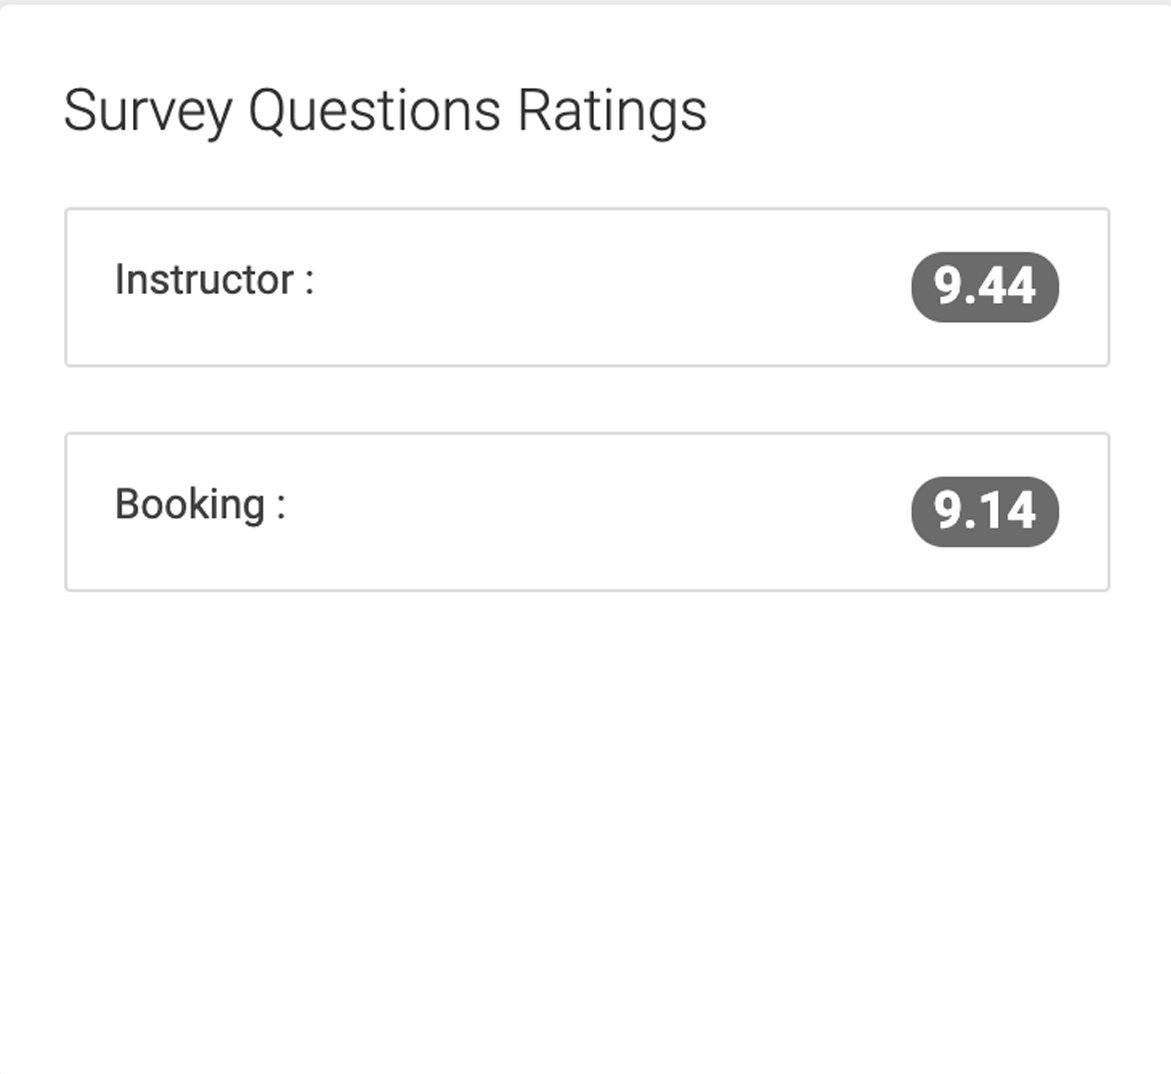
See survey results under Survey Questions Ratings in the Performance Report
Reviews
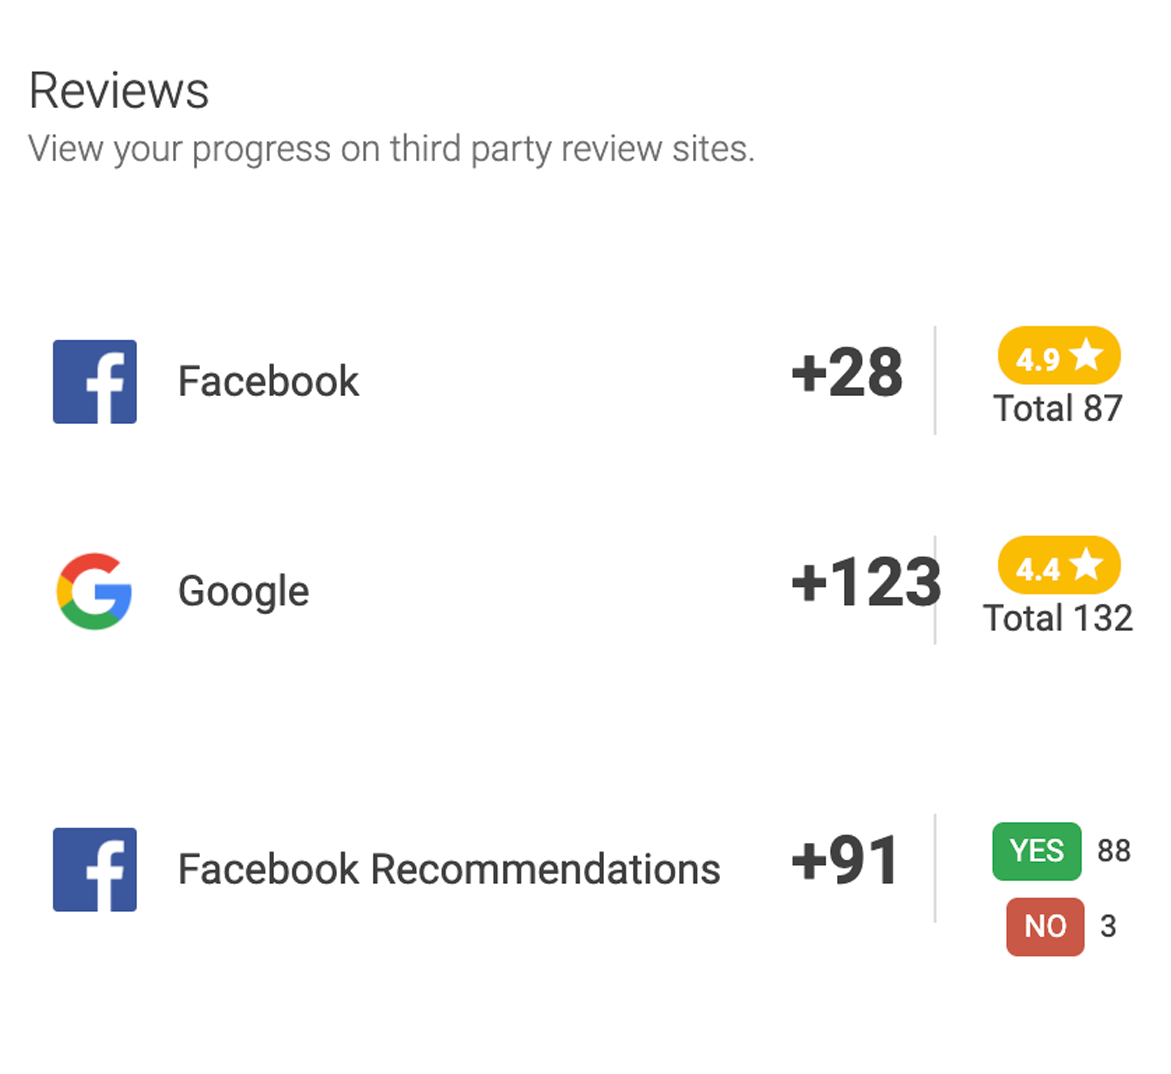
Reviews displays a location's progress on 3rd-party review sites. The sites you request reviews to are listed and metrics include; overall rating, total reviews, and the number of reviews received since starting Customer Feedback Centre.
Requests
Activity metrics for Email Requests and SMS Requests are available in the Performance Report under Feedback Process. The number of requests sent and opened, the total number of 1st-party ratings and/or reviews received (Feedback Received), and the number of clicks to review sites are displayed.
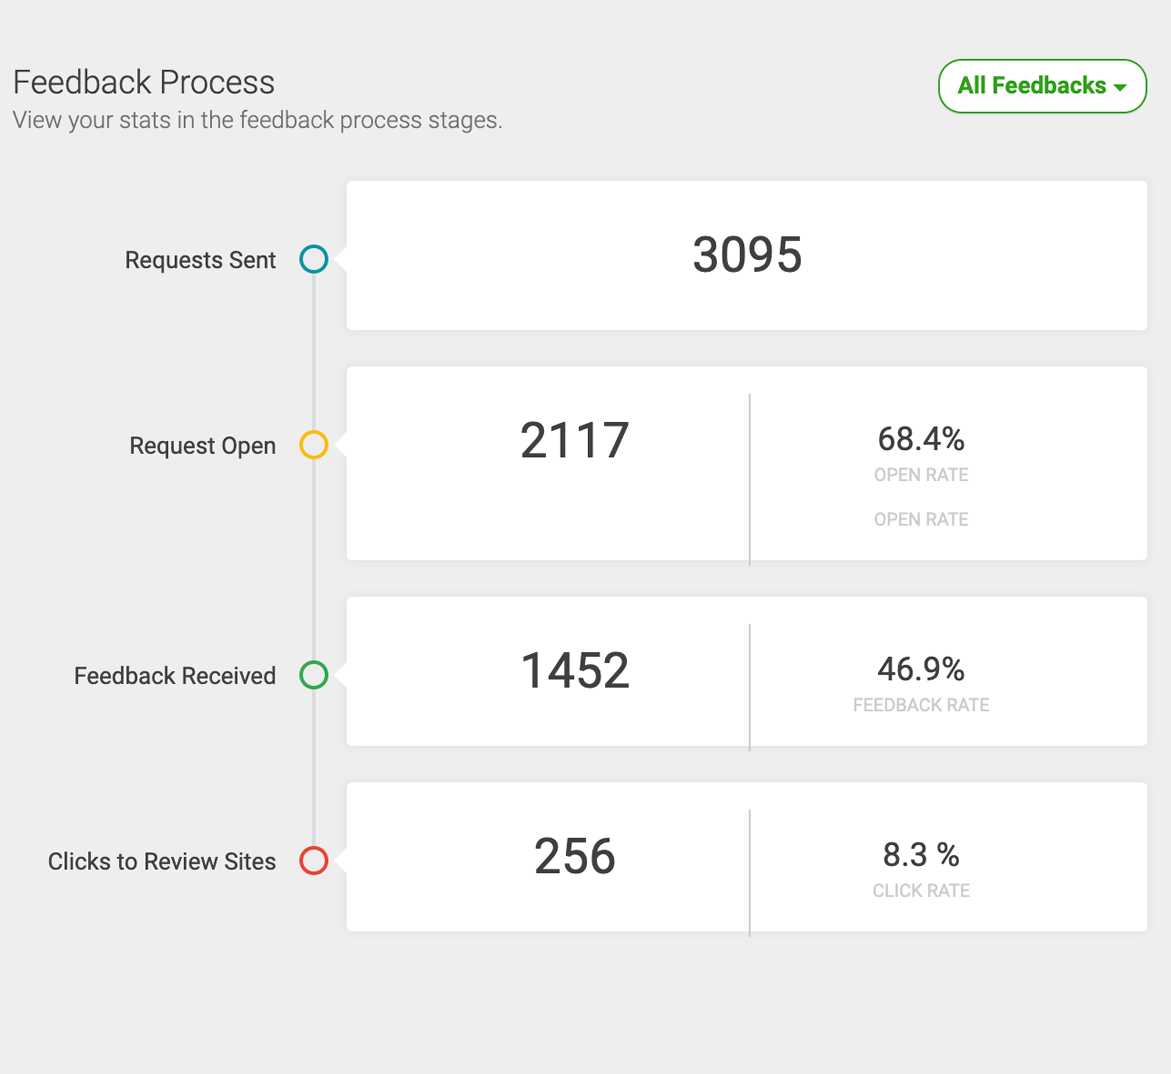
Activity metrics, including total requests sent and feedback received, for email and SMS requests are displayed under Feedback Process in the Performance Report
The default setting is set to display All Feedbacks, however, you can select to display activity metrics for "Only Email" or "Only SMS".
Additional Entry Points
Additional Entry Points displays the total number of customers that have left feedback using the Feedback URL, Kiosk Mode, Feedback Locator, or Feedback URL with Campaign Tracking.

Adjust Date Range of Performance Report
By default, the date range of the Performance Report is set to Lifetime. Additional selects are available and include:
Lifetime Past 90 Days Past 30 Days Past 7 Days Custom Date Range

Change the date range of the Performance Report to reflect metrics for the selected timeframe only
Access and Export the Performance Report
To access and export the Performance Report follow these steps:
Log in to your Customer Feedback Centre account. If you have multiple locations, select the location you would like to access the Performance Report for from the Business Dashboard. From the menu, go to Reports > Performance Report. Click Save as PDF to export.

Receive the Performance Report via Email
To receive the Performance Report via email follows these steps:
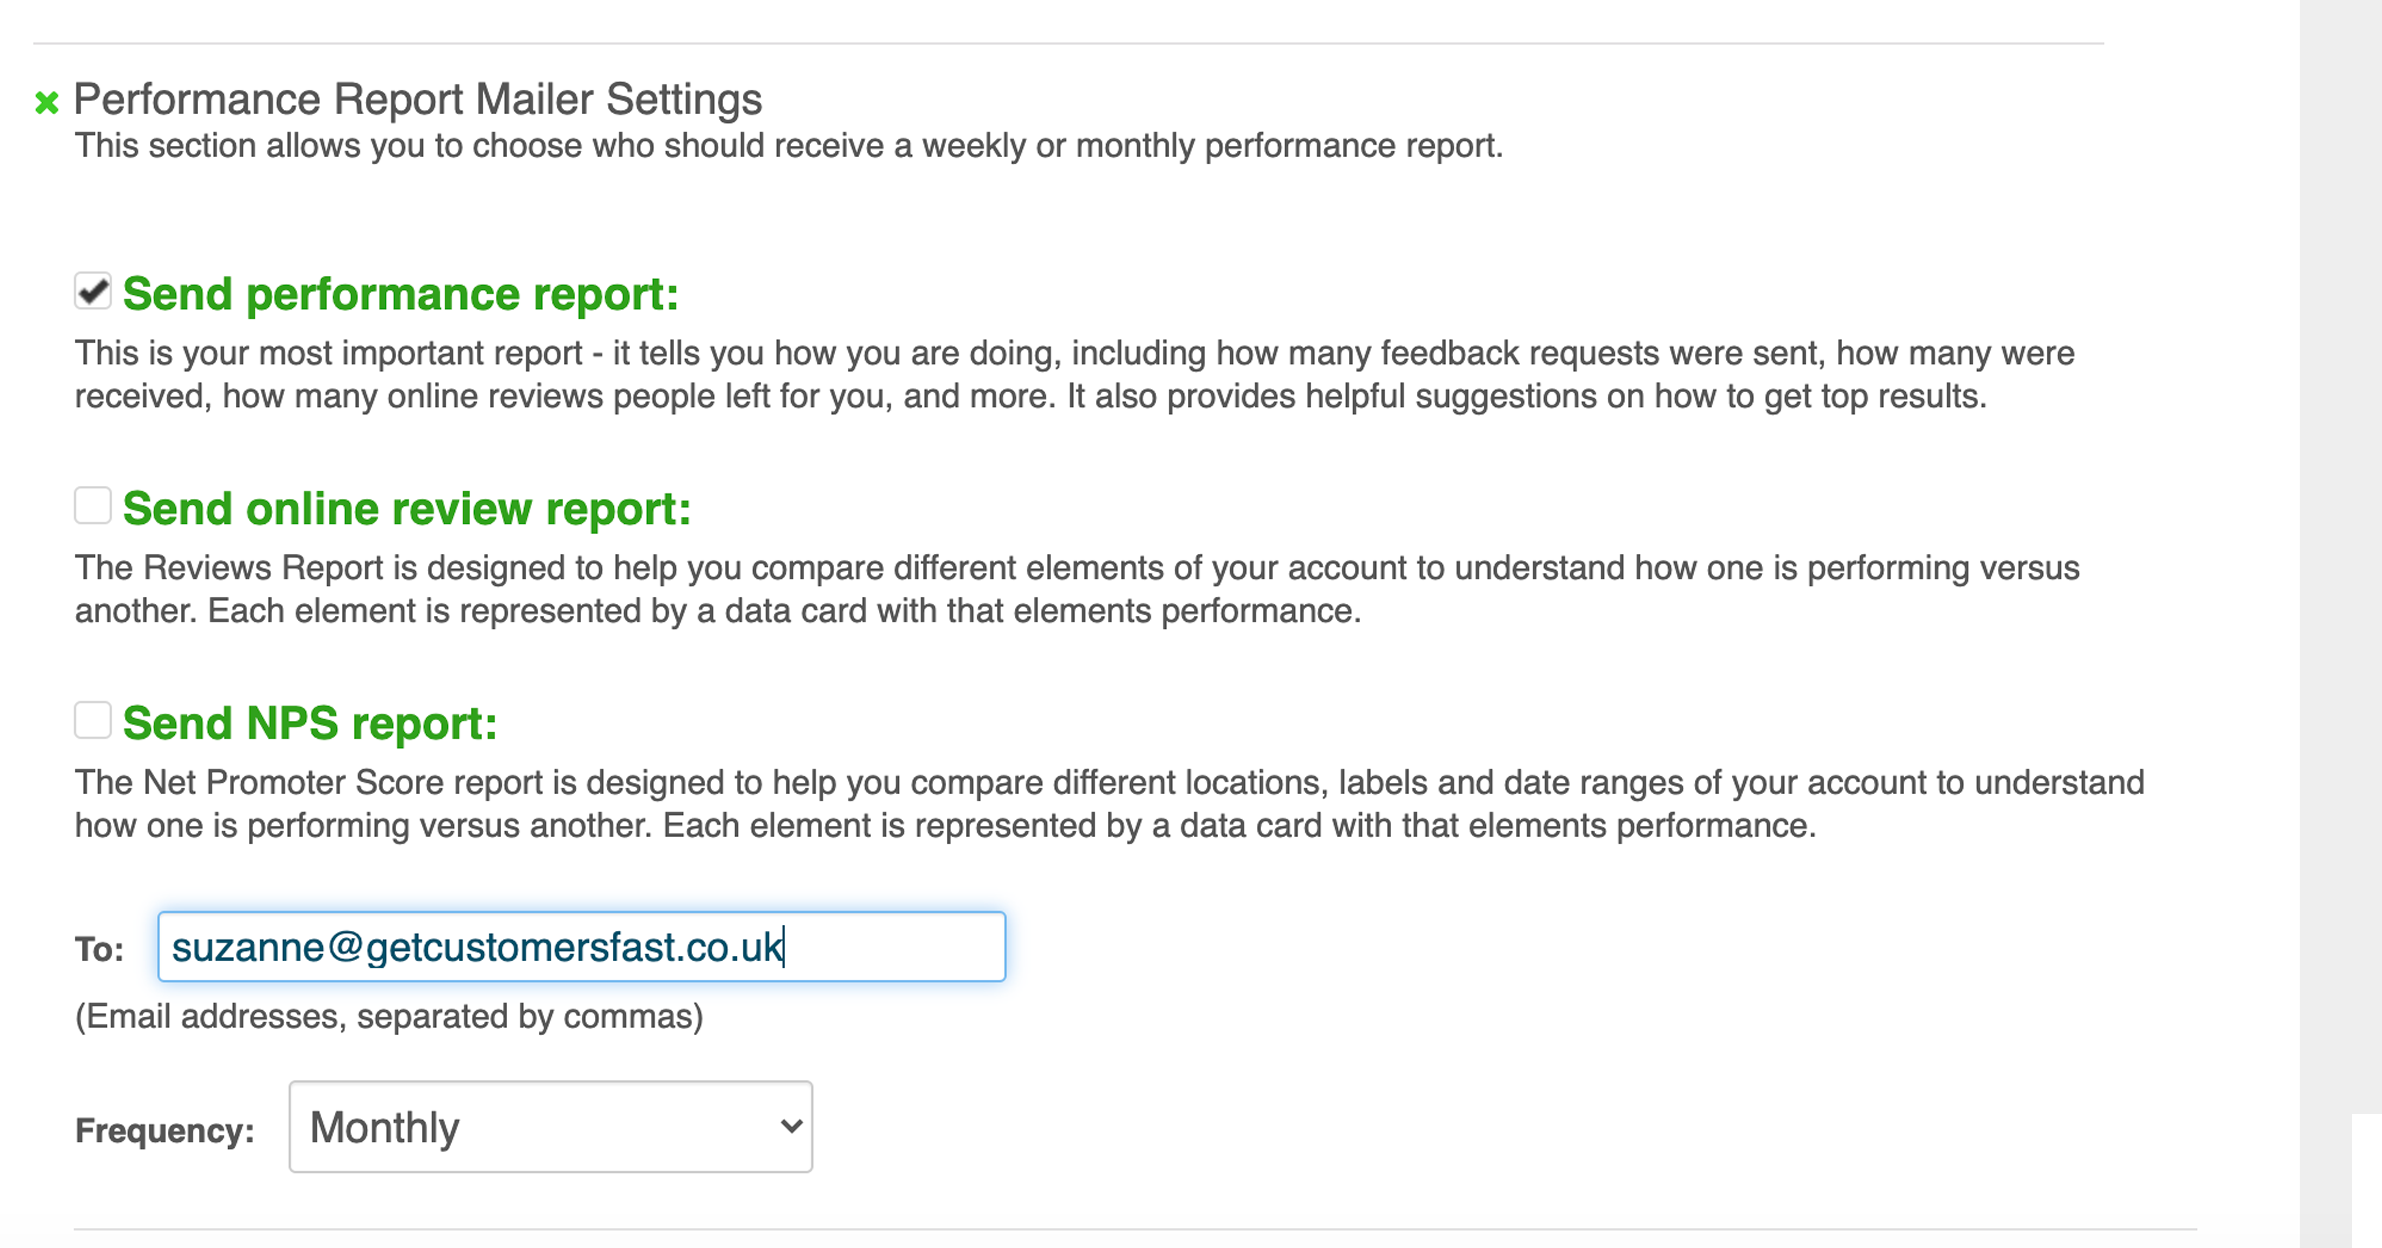
From the menu, go to Settings > Notifications. Click Performance Report Mailer Settings to expand the section.
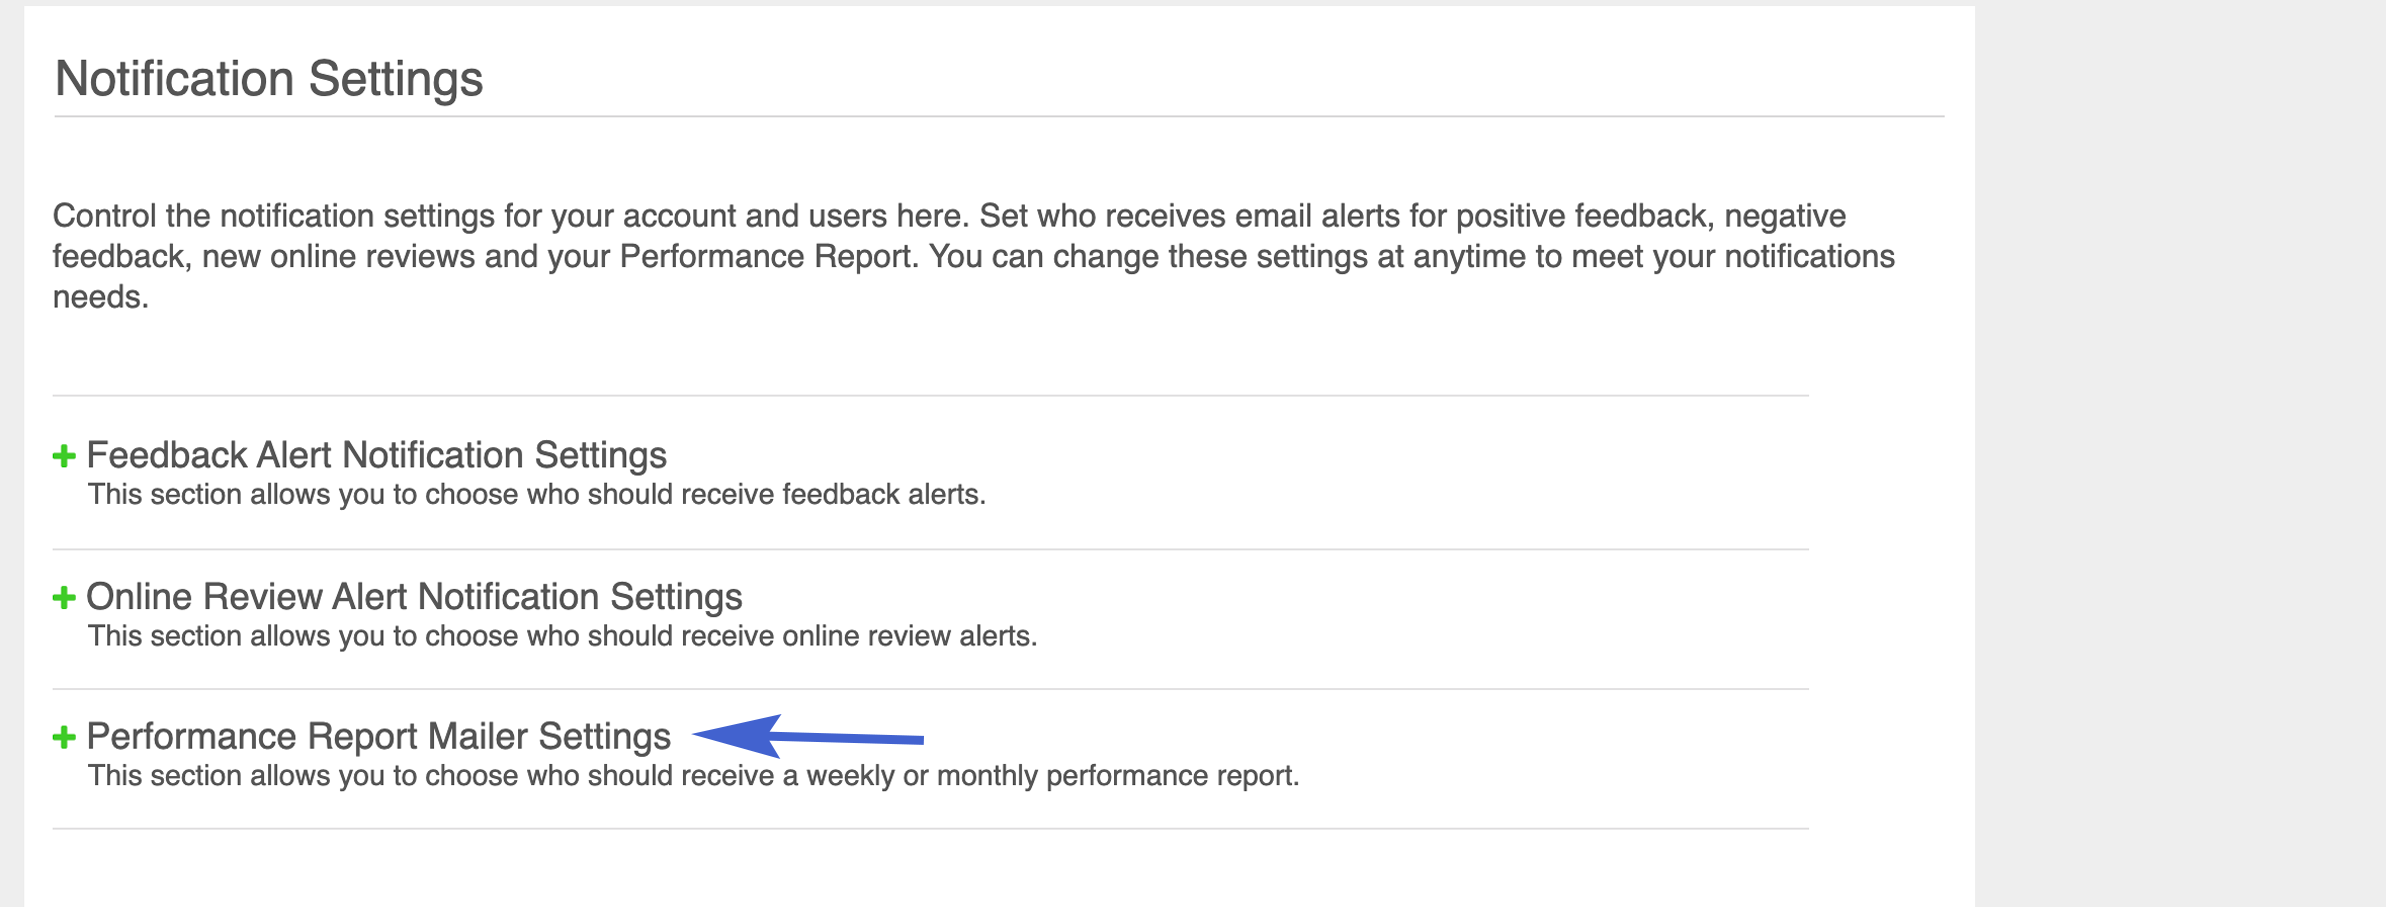
Complete the following:
Check Send performance report Enter the email address of each recipient separated by a comma. Select the frequency (monthly or weekly) you wish to receive the report.
